
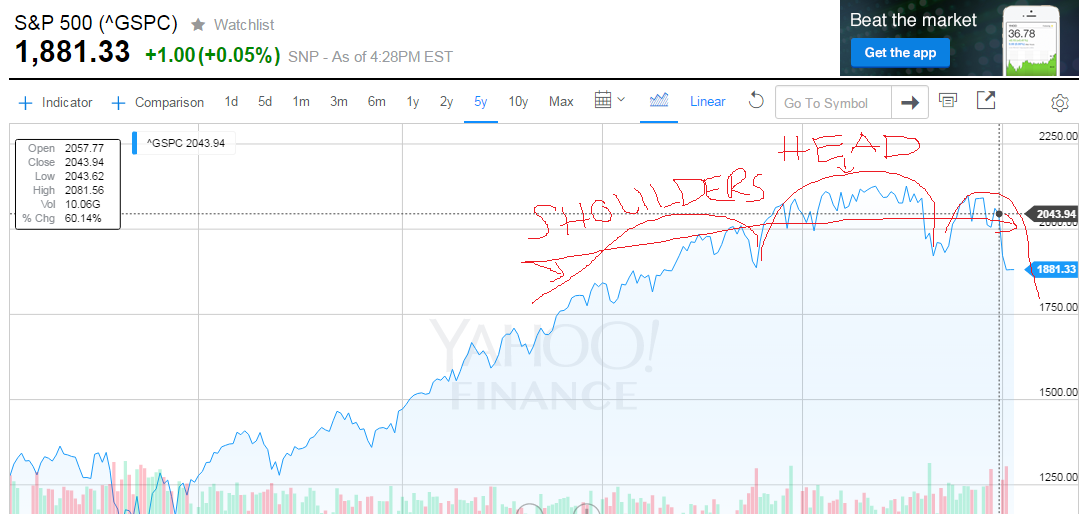
Well everyone, we are in the bear market. It’s been no joke, the stock market is down more than 10% since the last record in June 2018. Some stock guru are talking about the “head-and-shoulders” chart, where we see the 2nd shoulder then we’ll see a huge drop. As a dividend investors with the goal of getting $6,000 or the average of $500/mo this year. What do I do? Should I hold on to the cash? Should I sell my positions? I guess everybody is in the same boat.
This head and shoulder pattern signify a big stock decline

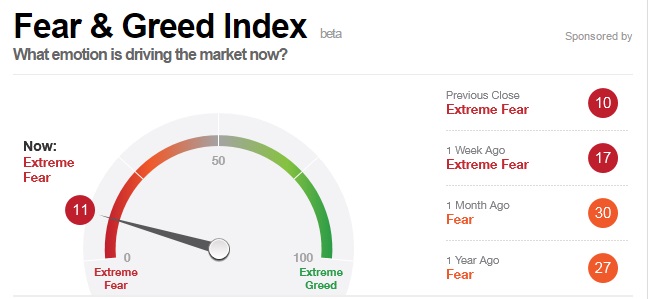
You can see from the CNN Fear-Greed index that people are in the extreme fear area now.
We can learn a lot from the last financial crisis, dividend investors are the last one to get out. I guess, whoever got out in March 2009 was probably kicking themselves. Because instead of picking up GE at $6/share, they bought it at the $30-40 level. Instead of averaging down at $6/share, they sold it at $6/share.
So what’s exactly we should buy then, when everybody is selling? I know, Dividend Aristocrats.
What is The Dividend Aristocrats list? It contains companies in the S&P 500 Index that have increased dividends every year for the last 25 straight years. Dividend Aristocrats are large cap, blue chip companies from many different industries, but they have all demonstrated a healthy balance between capital growth and dividend income.
Why do investors care so much about Dividend Aristocrats? Not surprisingly, stocks that have been able to increase their dividends for such a long period of time often have very durable businesses, have exhibited earnings growth, and have done quite well compared to the market.
Performance of the Dividend Aristocrats List
As seen below, the S&P Dividend Aristocrats Index has nicely outpaced the S&P 500 over the past decade. According to S&P, Dividend Aristocrats generated an annualized return of 10.2% over the past 10 years, easily topping the market’s 7.2% rate. Over this period, dividends accounted for 31% of the market’s total return, highlighting their importance in determining total shareholder return.

Blue chip dividend stocks are often characterized by outperformance during down markets. The following chart displays annual returns for Dividend Aristocrats alongside annual returns for the S&P 500. As you can see, dividend aristocrats fell about 22% in 2008 but significantly preserved shareholders’ capital when compared to the S&P 500’s 37% plunge.

Dividend aristocrats more than kept pace with the market in the years following the financial crisis. Outperforming in down markets and keeping up in up markets results in attractive risk-adjusted returns. Dividend aristocrats have a 13.8% standard deviation over the last 10 years, demonstrating lower volatility than the S&P 500, which recorded a 14.9% standard deviation over the same period.
Sector Mix of the Dividend Aristocrats List
The S&P Dividend Aristocrats Index currently contains 51 stocks with each equally-weighted. As you can see below, the consumer staples sector accounts for about 25% of the index. This is not surprising given the stability of most consumer staples markets. Information Technology is on the other end of the spectrum at less than 2% of the S&P Dividend Aristocrats Index. The rapid pace of change and continuous need to invest for growth make consistent dividend payouts less common.

Compared to the S&P 500, you can see that the Dividend Aristocrats Index is most overweight consumer staples, materials, and industrials. Information technology is the largest underweight, following the cyclical energy sector and financials, which were hit hard during the 2008-09 recession.

The biggest challenge with the Dividend Aristocrats list is that each stock must be a member of the S&P 500 Index, cutting out many other high quality dividend growth stocks. Over 150 dividend stocks have increased their dividend for at least 20 consecutive years, significantly more than the 51 Dividend Aristocrats.
Looking at the Sector weight, Financial sector should only be accountable for 13.2% of my total account, right now I’m sitting at 60%. I seriously need to work on that.
Some people have >80 stocks on their portfolio, but I feel it’d be hard to keep track of all of them. With 51, you can check each year to see if they cut their dividend and adjust your portfolio appropriately.
As for my 401K, everything staying put, I still have 70% in S&P and continue to average my cost. Either way, my company still putting 8% of my annual salary into it. I put another $18K. I don’t know when it the S&P hits bottom, I don’t want to miss out on the big gain, base on my past experiences, it will eventually even out over a period of 10 years to have the growth rate of 10%. So, why messing with it?
Leave a Reply