Summary
- A successful DGI portfolio can be created using very simple criteria. And using the dividend champion list.
- Just a couple of hours every quarter is all that is necessary to manage a well-designed DGI portfolio.
- My Well Rounded Investor portfolio continues to provide acceptable (to me) dividend growth and total return using the K.I.S.S method (keep it simple stupid) occasionally I have a break out and invest in the Dogs of the Dow, or Catching the Falling Knife, Dividend’s life method, any of these method can give me SWAN (sleep well at night 🙂
- Every now and then it is OK to break the letter from the KISS (but not the spirit) of your investing rules.
A successful investor it is essential to develop a system that suits your temperament, and to stick to that system. If you are someone who’s more comfortable if you have to talk to a financial adviser, feel free to do so. Sometimes opportunities come up when you may want to violate your rules somewhat. I made several purchases this year that did not strictly follow my guidelines. However, as I will discuss later, they still met the spirit of my system, so I do not feel I strayed too far, and I am comfortable with what I did.
It was a cool quarter having to see the market yoyoing. Some day it gained triple digits and quickly dissipated. I focus on my dividends going up, not my portfolio value. And my dividends continue to go up. I continue to have excellent dividend growth and I am still on track to meet my income goals. Therefore, I have no problem staying the course, and I continue to sleep well at night. DGI allows me to stay calm and relaxed, even if my portfolio has some rough patches, as long as my dividends keep increasing at a rate I am happy with. And if they do, I know that eventually the capital gains will follow along, and in the end, I still believe that my total return will match, if not beat, the market.
How is my recent quarter look?
- Aug $180.72 + 9.6%
- Sep $618.66 + 7.1%
- Oct $125.23 +45.93%
Quarterly dividend: $924.91. This is $74.09 shy from hitting $1000. It hasn’t reflected all the buys that I’ve made during the down turn and the recent buys. My 12-month forwarding dividend excluding the stocks that will increase dividend more than once a year.
Here are the stocks that increased dividend during this period that I currently own:
KMI (2.08%)*
O (0.26%)*
RY (2.60%)*
WPC (.10%)*
EMR
*asteric means the company increase more than once a year
My last update can be found here.
| 3M CO |
MMM |
9/1/2015 |
5 |
$139.66 |
$158.38 |
$698.30 |
$791.90 |
$20.49 |
$4.10 |
2.94% |
$20.50 |
| ALIBABA GRP HOLDING ADR |
BABA |
09/22/2014w
|
100 |
$90.51 |
$85.96 |
$7,179.00 |
$8,595.50 |
$33.25 |
$0.00 |
N/A |
N/A |
| AT & T INC |
T |
3/6/2015 |
30 |
$33.48 |
$33.01 |
$1,004.40 |
$990.23 |
$35.88 |
$1.88 |
5.62% |
$56.40 |
| BANK MONTREAL QUEBEC |
BMO |
|
22 |
$61.56 |
$57.92 |
$1,354.30 |
$1,274.24 |
$12.16 |
$2.49 |
|
$55.73 |
|
|
1/7/2015 |
12 |
$67.40 |
$57.92 |
$808.80 |
$695.04 |
$12.16 |
$2.49 |
3.76% |
$30.40 |
|
|
8/19/2015 |
10 |
$54.55 |
$57.92 |
$545.50 |
$579.20 |
$12.16 |
$2.49 |
4.64% |
$25.33 |
| BANK OF AMERICA CORP |
BAC |
|
5,688.00 |
$16.95 |
$17.97 |
$93,108.70 |
$102,216.77 |
$13.41 |
$0.20 |
|
$1,137.60 |
|
|
09/19/2014w
|
2,300.00 |
$17.00 |
$17.97 |
$35,788.00 |
$41,332.38 |
$13.41 |
$0.20 |
1.29% |
$460.00 |
|
|
9/22/2014 |
1,500.00 |
$17.08 |
$17.97 |
$25,614.30 |
$26,955.90 |
$13.41 |
$0.20 |
1.17% |
$300.00 |
|
|
11/5/2014 |
583 |
$17.33 |
$17.97 |
$10,103.39 |
$10,476.86 |
$13.41 |
$0.20 |
1.15% |
$116.60 |
|
|
12/8/2014 |
573 |
$17.61 |
$17.97 |
$10,092.99 |
$10,297.15 |
$13.41 |
$0.20 |
1.14% |
$114.60 |
|
|
1/6/2015 |
80 |
$17.12 |
$17.97 |
$1,369.59 |
$1,437.65 |
$13.41 |
$0.20 |
1.17% |
$16.00 |
|
|
1/9/2015 |
90 |
$17.08 |
$17.97 |
$1,537.19 |
$1,617.35 |
$13.41 |
$0.20 |
1.17% |
$18.00 |
|
|
1/14/2015 |
15 |
$16.11 |
$17.97 |
$241.65 |
$269.56 |
$13.41 |
$0.20 |
1.24% |
$3.00 |
|
|
3/25/2015 |
86 |
$15.56 |
$17.97 |
$1,338.16 |
$1,545.47 |
$13.41 |
$0.20 |
1.29% |
$17.20 |
|
|
3/25/2015 |
50 |
$15.55 |
$17.97 |
$777.50 |
$898.53 |
$13.41 |
$0.20 |
1.29% |
$10.00 |
|
|
4/15/2015 |
200 |
$15.63 |
$17.97 |
$3,127.00 |
$3,594.12 |
$13.41 |
$0.20 |
1.28% |
$40.00 |
|
|
10/2/2015 |
111 |
$14.68 |
$17.97 |
$1,628.93 |
$1,994.74 |
$13.41 |
$0.20 |
1.36% |
$22.20 |
|
|
10/2/2015 |
100 |
$14.90 |
$17.97 |
$1,490.00 |
$1,797.06 |
$13.41 |
$0.20 |
1.34% |
$20.00 |
| BAXALTA INC |
BXLT |
5/13/2015 |
10 |
$30.54 |
$34.37 |
$305.35 |
$343.70 |
$21.04 |
$0.28 |
0.92% |
$2.80 |
| BAXTER INTERNATIONAL INC |
BAX |
5/13/2015 |
10 |
$37.63 |
$37.41 |
$376.25 |
$374.10 |
$11.99 |
$0.46 |
1.22% |
$4.60 |
| BK NOVA SCOTIA HALIFAX |
BNS |
8/19/2015 |
10 |
$45.60 |
$46.38 |
$456.00 |
$463.80 |
$11.54 |
$2.13 |
4.74% |
$21.63 |
| BLACKSTONE MORTGAGE |
BXMT |
6/24/2015 |
20 |
$28.95 |
$27.83 |
$579.00 |
$556.60 |
$13.58 |
$2.48 |
8.57% |
$49.60 |
| CAPITAL ONE FINANCIAL |
COF |
|
30 |
$78.04 |
$80.99 |
$2,341.30 |
$2,429.55 |
$11.23 |
$1.60 |
|
$48.00 |
|
|
4/27/2015 |
10 |
$81.05 |
$80.99 |
$810.50 |
$809.85 |
$11.23 |
$1.60 |
1.97% |
$16.00 |
|
|
8/21/2015 |
10 |
$78.27 |
$80.99 |
$782.70 |
$809.85 |
$11.23 |
$1.60 |
2.04% |
$16.00 |
|
|
9/4/2015 |
10 |
$74.81 |
$80.99 |
$748.10 |
$809.85 |
$11.23 |
$1.60 |
2.14% |
$16.00 |
| CATERPILLAR INC |
CAT |
|
35 |
$74.27 |
$72.89 |
$2,599.52 |
$2,551.15 |
$15.12 |
$3.08 |
|
$107.80 |
|
|
3/6/2015 |
10 |
$80.66 |
$72.89 |
$806.57 |
$728.90 |
$15.12 |
$3.08 |
3.82% |
$30.80 |
|
|
9/3/2015 |
10 |
$74.13 |
$72.89 |
$741.30 |
$728.90 |
$15.12 |
$3.08 |
4.16% |
$30.80 |
|
|
9/18/2015 |
10 |
$72.46 |
$72.89 |
$724.60 |
$728.90 |
$15.12 |
$3.08 |
4.25% |
$30.80 |
|
|
9/24/2015 |
5 |
$65.41 |
$72.89 |
$327.05 |
$364.45 |
$15.12 |
$3.08 |
4.71% |
$15.40 |
| CHEMOURS CO |
CC |
6/24/2015 |
2 |
$16.86 |
$7.39 |
$33.73 |
$14.77 |
$6.33 |
$0.12 |
0.71% |
$0.24 |
| CITIGROUP INC NEW |
C |
3/4/2015 |
100 |
$53.56 |
$55.94 |
$5,356.49 |
$5,594.00 |
$12.63 |
$0.20 |
0.37% |
$20.00 |
| CUMMINS INC |
CMI |
10/30/2015 |
10 |
$103.64 |
$105.71 |
$1,036.39 |
$1,057.10 |
$11.32 |
$3.90 |
3.76% |
$39.00 |
| DARDEN RESTAURANTS |
DRI |
6/24/2015 |
10 |
$71.10 |
$61.47 |
$711.00 |
$614.70 |
$26.73 |
$2.20 |
3.09% |
$22.00 |
| DEERE & CO |
DE |
3/6/2015 |
10 |
$90.02 |
$76.48 |
$900.20 |
$764.80 |
$11.26 |
$2.40 |
2.67% |
$24.00 |
| DIAGEO PLC |
DEO |
2/13/2015 |
15 |
$113.72 |
$113.64 |
$1,705.80 |
$1,704.60 |
$19.13 |
$3.41 |
3.00% |
$51.21 |
| DOMINION RES INC VA NEW |
D |
10/29/2015 |
100 |
$70.78 |
$67.93 |
$7,078.50 |
$6,793.00 |
$22.42 |
$2.59 |
3.66% |
$259.00 |
| DOVER CORP COMMON |
DOV |
9/1/2015 |
10 |
$59.76 |
$63.89 |
$597.60 |
$638.90 |
$11.49 |
$1.68 |
2.81% |
$16.80 |
| DU PONT E.I. DE NEMOURS |
DD |
6/24/2015 |
10 |
$62.98 |
$65.90 |
$629.76 |
$659.00 |
$20.85 |
$1.52 |
2.41% |
$15.20 |
| EBAY INC |
EBAY |
7/8/2015 |
20 |
$23.96 |
$29.28 |
$479.11 |
$585.60 |
$16.45 |
$0.00 |
N/A |
N/A |
| EMERSON ELECTRIC CO |
EMR |
8/21/2015 |
10 |
$48.53 |
$48.67 |
$485.30 |
$486.70 |
$12.20 |
$1.90 |
3.92% |
$19.00 |
| FORD MOTOR COMPANY |
F |
|
73 |
$14.84 |
$14.46 |
$1,083.55 |
$1,055.21 |
$12.15 |
$0.60 |
|
$43.80 |
|
|
4/30/2015 |
3 |
$15.85 |
$14.46 |
$47.55 |
$43.37 |
$12.15 |
$0.60 |
3.79% |
$1.80 |
|
|
6/3/2015 |
50 |
$15.20 |
$14.46 |
$760.00 |
$722.75 |
$12.15 |
$0.60 |
3.95% |
$30.00 |
|
|
9/1/2015 |
20 |
$13.80 |
$14.46 |
$276.00 |
$289.10 |
$12.15 |
$0.60 |
4.35% |
$12.00 |
| GOLDMAN SACHS GROUP INC |
GS |
|
10 |
$180.88 |
$198.44 |
$1,808.80 |
$1,984.38 |
$13.05 |
$2.60 |
|
$26.00 |
|
|
9/1/2015 |
5 |
$182.35 |
$198.44 |
$911.75 |
$992.19 |
$13.05 |
$2.60 |
1.43% |
$13.00 |
|
|
9/4/2015 |
5 |
$179.41 |
$198.44 |
$897.05 |
$992.19 |
$13.05 |
$2.60 |
1.45% |
$13.00 |
| HCP INC |
HCP |
11/5/2015 |
10 |
$35.28 |
$34.22 |
$352.80 |
$342.20 |
$65.81 |
$2.26 |
6.41% |
$22.60 |
| INTERNATIONAL BUSINESS |
IBM |
9/1/2015 |
5 |
$143.00 |
$138.31 |
$715.00 |
$691.55 |
$9.56 |
$5.20 |
3.64% |
$26.00 |
| JPMORGAN CHASE & CO |
JPM |
|
20 |
$62.30 |
$68.48 |
$1,246.10 |
$1,369.50 |
$11.69 |
$1.76 |
|
$35.20 |
|
|
4/27/2015 |
10 |
$62.96 |
$68.48 |
$629.60 |
$684.75 |
$11.69 |
$1.76 |
2.80% |
$17.60 |
|
|
9/1/2015 |
10 |
$61.65 |
$68.48 |
$616.50 |
$684.75 |
$11.69 |
$1.76 |
2.86% |
$17.60 |
| KINDER MORGAN INC DEL |
KMI |
|
50 |
$31.36 |
$25.52 |
$1,568.00 |
$1,275.75 |
$48.14 |
$2.04 |
|
$102.00 |
|
|
5/29/2015 |
10 |
$41.54 |
$25.52 |
$415.40 |
$255.15 |
$48.14 |
$2.04 |
4.91% |
$20.40 |
|
|
8/11/2015 |
10 |
$32.33 |
$25.52 |
$323.30 |
$255.15 |
$48.14 |
$2.04 |
6.31% |
$20.40 |
|
|
9/28/2015 |
10 |
$28.77 |
$25.52 |
$287.70 |
$255.15 |
$48.14 |
$2.04 |
7.09% |
$20.40 |
|
|
10/27/2015 |
10 |
$27.37 |
$25.52 |
$273.70 |
$255.15 |
$48.14 |
$2.04 |
7.45% |
$20.40 |
|
|
10/30/2015 |
10 |
$26.79 |
$25.52 |
$267.90 |
$255.15 |
$48.14 |
$2.04 |
7.62% |
$20.40 |
| LUMBER LIQUIDATORS HLDGS |
LL |
4/29/2015 |
43 |
$27.03 |
$16.99 |
$1,162.29 |
$730.57 |
N/A |
$0.00 |
N/A |
N/A |
| NORFOLK SOUTHERN CORP |
NSC |
|
14 |
$82.43 |
$79.65 |
$1,154.08 |
$1,115.10 |
$14.38 |
$2.36 |
|
$33.04 |
|
|
6/24/2015 |
4 |
$90.07 |
$79.65 |
$360.28 |
$318.60 |
$14.38 |
$2.36 |
2.62% |
$9.44 |
|
|
8/21/2015 |
10 |
$79.38 |
$79.65 |
$793.80 |
$796.50 |
$14.38 |
$2.36 |
2.97% |
$23.60 |
| ONEOK INC NEW |
OKE |
10/30/2015 |
10 |
$33.11 |
$31.02 |
$331.10 |
$310.20 |
$20.82 |
$2.46 |
7.43% |
$24.60 |
| PAYPAL HOLDINGS INC |
PYPL |
7/8/2015 |
20 |
$37.05 |
$36.16 |
$740.89 |
$723.20 |
$38.48 |
$0.00 |
N/A |
N/A |
| POTASH CORP OF |
POT |
10/30/2015 |
10 |
$20.05 |
$20.39 |
$200.50 |
$203.90 |
$11.52 |
$1.52 |
7.58% |
$15.20 |
| PRINCIPAL FINANCIAL |
PFG |
4/27/2015 |
10 |
$52.01 |
$51.60 |
$520.05 |
$516.00 |
$12.52 |
$1.52 |
2.92% |
$15.20 |
| PROCTER & GAMBLE CO |
PG |
|
20 |
$73.47 |
$74.90 |
$1,469.50 |
$1,497.90 |
$28.16 |
$2.65 |
|
$53.04 |
|
|
5/29/2015 |
10 |
$78.35 |
$74.90 |
$783.50 |
$748.95 |
$28.16 |
$2.65 |
3.39% |
$26.52 |
|
|
9/4/2015 |
10 |
$68.60 |
$74.90 |
$686.00 |
$748.95 |
$28.16 |
$2.65 |
3.87% |
$26.52 |
| REALTY INCOME CORP |
O |
3/6/2015 |
50 |
$48.83 |
$47.81 |
$2,441.50 |
$2,390.50 |
$43.51 |
$2.29 |
4.68% |
$114.30 |
| ROYAL BANK CANADA |
RY |
8/19/2015 |
10 |
$57.12 |
$57.69 |
$571.20 |
$576.90 |
$11.69 |
$2.40 |
4.27% |
$24.41 |
| STARWOOD PROPERTY TR INC |
STWD |
6/24/2015 |
20 |
$22.64 |
$20.63 |
$452.80 |
$412.60 |
$9.69 |
$1.92 |
8.48% |
$38.40 |
| T ROWE PRICE GROUP INC |
TROW |
9/1/2015 |
10 |
$69.55 |
$76.58 |
$695.50 |
$765.80 |
$16.61 |
$2.08 |
2.99% |
$20.80 |
| TORONTO DOMINION BK |
TD |
8/21/2015 |
10 |
$38.65 |
$41.07 |
$386.50 |
$410.70 |
$13.04 |
$1.55 |
4.08% |
$15.76 |
| TWENTY-FIRST CENTY |
FOXA |
|
20 |
$32.37 |
$29.83 |
$647.30 |
$596.60 |
$8.00 |
$0.30 |
|
$6.00 |
|
|
4/27/2015 |
10 |
$34.81 |
$29.83 |
$348.10 |
$298.30 |
$8.00 |
$0.30 |
0.86% |
$3.00 |
|
|
8/19/2015 |
10 |
$29.92 |
$29.83 |
$299.20 |
$298.30 |
$8.00 |
$0.30 |
1.00% |
$3.00 |
| UNION PACIFIC CORP |
UNP |
|
20 |
$93.35 |
$86.25 |
$1,867.00 |
$1,725.00 |
$14.90 |
$2.20 |
|
$44.00 |
|
|
6/24/2015 |
10 |
$98.26 |
$86.25 |
$982.60 |
$862.50 |
$14.90 |
$2.20 |
2.24% |
$22.00 |
|
|
8/21/2015 |
10 |
$88.44 |
$86.25 |
$884.40 |
$862.50 |
$14.90 |
$2.20 |
2.49% |
$22.00 |
| VERIZON COMMUNICATIONS |
VZ |
9/29/2014 |
200 |
$49.50 |
$45.53 |
$9,899.22 |
$9,105.00 |
$18.14 |
$2.26 |
4.57% |
$452.00 |
| W P CAREY INC |
WPC |
6/24/2015 |
10 |
$61.34 |
$63.14 |
$613.40 |
$631.40 |
$44.15 |
$3.82 |
6.23% |
$38.20 |
| WAL-MART STORES INC |
WMT |
|
150 |
$69.91 |
$58.54 |
$10,487.00 |
$8,780.25 |
$12.22 |
$1.96 |
|
$294.00 |
|
|
3/6/2015 |
20 |
$82.63 |
$58.54 |
$1,652.60 |
$1,170.70 |
$12.22 |
$1.96 |
2.37% |
$39.20 |
|
|
5/20/2015 |
20 |
$76.42 |
$58.54 |
$1,528.40 |
$1,170.70 |
$12.22 |
$1.96 |
2.57% |
$39.20 |
|
|
6/4/2015 |
20 |
$74.15 |
$58.54 |
$1,483.00 |
$1,170.70 |
$12.22 |
$1.96 |
2.64% |
$39.20 |
|
|
8/18/2015 |
40 |
$69.55 |
$58.54 |
$2,782.00 |
$2,341.40 |
$12.22 |
$1.96 |
2.82% |
$78.40 |
|
|
9/1/2015 |
10 |
$64.08 |
$58.54 |
$640.80 |
$585.35 |
$12.22 |
$1.96 |
3.06% |
$19.60 |
|
|
10/14/2015 |
20 |
$61.24 |
$58.54 |
$1,224.80 |
$1,170.70 |
$12.22 |
$1.96 |
3.20% |
$39.20 |
|
|
10/15/2015 |
20 |
$58.77 |
$58.54 |
$1,175.40 |
$1,170.70 |
$12.22 |
$1.96 |
3.34% |
$39.20 |
| WELLS FARGO COMPANY |
WFC |
|
530 |
$51.22 |
$55.78 |
$27,148.20 |
$29,562.02 |
$13.47 |
$1.50 |
|
$795.00 |
|
|
7/11/2014 |
500 |
$51.12 |
$55.78 |
$25,560.00 |
$27,888.70 |
$13.47 |
$1.50 |
2.93% |
$750.00 |
|
|
1/9/2015 |
30 |
$52.94 |
$55.78 |
$1,588.20 |
$1,673.32 |
$13.47 |
$1.50 |
2.83% |
$45.00 |
| Total Stocks |
|
|
|
|
|
$196,578.28 |
$206,272.94 |
|
|
|
$4,210.65 |
Results and Portfolio Review
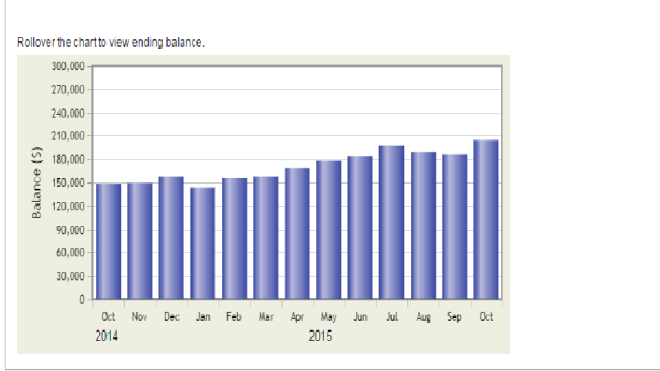
My portfolio’s value has increased from $192621.80 to $211,292.3 ($206,272.94 in stock + $5019.36 cash)
The total gain with cash is $18671.30
when you consider that during this time an additional $15593.59 of new cash was added to the account. +$3077.71 was the gain from the investment during this period.
Total account $211,292.3
Total cash investment: $196578.28
total account gain: $14714.02
total ytd dividend gain: $2525.94
total return: $17239.96, in percentage gain +8.16%
As compared to the + return of my portfolio, the return of each of my benchmarks for this quarter is as follows:
S&P 500: +3.76% (I used fidelity S&P 500, which is similar to the real S&P 500)
My portfolio: +8.16%
It’s been a tough quarter, for the whole market, and for my portfolio as well. However it continues to perform well on a dividends produced basis, and on a dividend growth basis. I set my goal this year to achieve $3000 in dividend. But going forward my portfolio is now expected to produce $4,210.65 in dividends over the next 12 months, an increase of 27%. And for the first time, I will be collecting over $1,000 in dividends in quarter by year end. It should be mentioned that this is due to a combination of both organic dividend growth of my individual holdings, and the dividends produced from new money added to the portfolio over the past year and quarter. My present dividend yield is 2.041%. This is higher than it has ever been, but not by any kind of conscious effort on my part. I have not purposefully tried to buy higher yielding stocks during the first half of the year, as I was focusing on buying financial sector. It is the drop in price of many of my stocks, and of my portfolio as a whole, combined with the continuing dividend growth, that has brought my yield up so high.
So my plan going forward is to continue to focus on the dividends and to follow several safe rules. They have been working very well so far. I believe my results continue to support my hypothesis: that by using simple, straightforward, easy-to-understand criteria for buying and selling, and by using the hard work of other people

Very solid growth in your portfolio value lately, Congrats. Looks like you hold lots of solid stocks, keep purchasing and assimilating shares. 🙂
Thank you! Couldn’t make it without you and other PF bloggers. Looking forward to have the same level of success as your portfolio.
Hi Vivianne
Oh my my, +$18K during one month is not a small joke. How did you manage to get those huge cash amount to inject for one month? I envy, urghh 🙂
Congrats on beating the $200K point and my oh my you are flying over here like an eagle.
B,
when you wrote your portfolio projection, you were in your early 20s. I’m way behind the curve here. You are truly inspirational. Thank you for paving the way.
Impressive portfolio Vivianne! It must feel great crossing the 200k Mark. I can’t wait to get there myself 😀
Regards
Dividend Freedom
Man, I recently found your blog, and I’ll keep coming back. Our portfolios are in growing stage so, I’ll keep coming back to your blog to find inspiration.
Thanks for stopping by and commenting.